

Chronic Diseases in British Columbia & Fraser North Region [Surrey, BC]
- Shabin Mere
- Nov 4, 2023
- 7 min read

Updated: Dec 1, 2023

(EZ MD Solutions, 2023)
The BC Center for Disease provides a Chronic Disease Dashboard with an interactive tool outlining statistics on a variety of non-communicable diseases and conditions in BC (Chronic disease dashboard 2023). The dashboard reveals that in the 20/21 fiscal year the top three Chronic Diseases prominent in British Columbia, based on Age-Standardized Incidence per 100,000 population for Leading Conditions in All BC, 2020/2021 for All Ages, Both Male and Female were:

(Chronic disease dashboard 2023)
Digging further into the same data specific to my health area of Surrey BC, which includes BC CDC’s category of the Fraser North Region, again based on Age-Standardized Incidence per 100,000 population for Leading Conditions in --Fraser North, 2020/2021 for All Ages, Both Male & Female were:
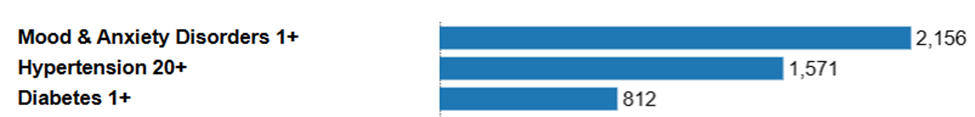
(Chronic disease dashboard 2023)
The two Chronic Diseases that were the same for both sets of stats in the 2020/2021 fiscal year remain as Mood and Anxiety Disorders, and Hypertension. This amounts to 0.282% (282 per 100,000 people) of BC’s population years reported by BCCDC to have Mood and Anxiety Disorder in the Fraser North Region, and only 0.052% (52 per 100,000 people) were reported to have Hypertension (2023). Using this same tool to further break down the data by male and female populations, you can see the trend of changes between the years 2001 to 2021. These graphs show the comparisons for all of BC vs. the Fraser North Region, demonstrating that in 2001 there was a heightened incidence of Mood and Anxiety Disorder, which then decreased over the decade, but came back up in 2020/2021.


(Chronic disease dashboard 2023)
It is interesting to see this variation for both sexes of all ages, within the 20 years, and rising at the time of the Covid-19 pandemic years. There appears to be a higher incidence of Mood and Anxiety disorder in my region among women compared to men throughout the decade between 2001 and 2021, in every age category, with the highest numbers among those aged 20-34 years old. While most of the ages appear to be close in range for females vs. males, the number of incidences for females aged 20-34 was the highest in that fiscal year.


(Chronic disease dashboard 2023)
For data on Hypertension, we can see that all of BC, as well as the Fraser North Region, appears to have had a rise of incidences back in the 2006/2007 fiscal year, and then decreasing over the years, and even becoming at it’s lowest in 2014/2015. Thereafter, it rose back up again during the start of the pandemic but then decreased during the pandemic in 2020/2021. Here you can see that there is a higher incidence of Hypertension among the males vs. the females compared to the data shown for Mood and Anxiety Disorders. I see that at the start of the new millennium, the stats were almost equal among females and males, however, the trend became parallel for each year as of the 2006/2007 fiscal year.


(Chronic disease dashboard 2023)
For incidences of Hypertension, there appears to be a higher rise in stats in my region among the aged 65-79 years old. While the male incidences are higher than the women, you can see that they are not too far apart through all the age categories.


(Chronic disease dashboard 2023)
The third most common Chronic Disease in my Region is Diabetes. The first graph shows the variation in stats between the 20 years, with the highest incidences occurring in the 2009/2010 fiscal year. Here you can see that the male and female data is parallel throughout the 20 years, until the 2020/2021 fiscal year, where the incidences are at the same rate for both in the Fraser North Region. However, for all of BC, the stats remained parallel between males and females throughout the 20 years. Yet, both graphs show the highest incidences both within the Fraser North Region as well as all of BC in the 2009/2010 fiscal year.


(Chronic disease dashboard 2023)
Statistics Canada has also indicated Mood and Anxiety Disorders as one of the top chronic conditions in Canada, stating:
In 2021, over 3.4 million Canadians aged 12 years and older (10.4%) reported having been diagnosed with an anxiety disorder, and over 3.1 million (9.6%) reported having been diagnosed with a mood disorder. The prevalence of anxiety (+2.6 percentage points) and mood disorders (+1.7 percentage points) has increased since 2015 (Government of Canada, Top Five highlights from a new report on the health of Canadians, 2023).
Reviewing the top two chronic diseases reported in BC in 2020/2021, being Mood and Anxiety, and hypertension, as I mentioned earlier, we can see that the timelines of the rise in numbers occurred during the brunt of the pandemic.
In a report published by BCCDC in 2021, the data collected at the time of the pandemic showed that “[y]oung British Columbians … under 30 years of age endorsed that COVID-19 had worsened their mental health (61%), was a threat to their mental health (23%), and impacted their level of stress (24%) more so than those aged 65 and older (34%, 9%, and 10%, respectively)”. This is demonstrated in the graph that compares the data for young adults aged 18-30 vs. BC overall.

(Impacts of the COVID-19 pandemic on the health and well-being of young ... 2021, fig. 2, p.21)
According to the report from BCCDC (2021) the primary determinants of this chronic disease were found to be the effects of social isolation and other factors related to the impact of Covid-19. “Further, these young adults felt less able to cope with their daily stress compared to older adults… [with] many [of them] feeling either quite or extremely stressed… or helpless” (Impacts of the COVID-19 pandemic on the health and well-being of young ... 2021, p. 21). BCCDC found that these young adults presented with worries about the pandemic impacting their “vulnerable family members’ health” (2021), and variations in stats were based on their living situation. “Results from Foundry’s COVID-19 report highlight that 89% of young people accessing virtual services were either in high or very high distress at the first visit… [showing that of] 270 visits from April to December 2020, 70% were by young people 18-24 years of age"(Impacts of the COVID-19 pandemic on the health and well-being of young ... 2021, p. 21). The stats collected in my research above were specific to the 2020/2021 fiscal year because that is the most recent year reported on the BCCDC website. I attributed the high stats of Mood and Anxiety to COVID-19, therefore was attempting to find data related to the rise being correlated to the pandemic as well. There does not appear to be any specific documentation on whether COVID-19 had any direct impact on the increase of hypertension incidences that year in BC or Canada. However, there were studies done in the United States that describe the primary determinants of hypertension in relation to the pandemic timeline reported by Van Beusekom (2022) in a university newspaper article. The article indicates that “Americans with chronic high blood pressure (BP) monitored their condition less often and reported small but consequential BP increases early in the COVID-19 pandemic” (Van Beusekom, 2022).
It is safe to say that in Canada, the changes in the population with already existing hypertension would likely have been affected by the sudden changes in lifestyle during the pandemic:
The shift by Canadians to a more physically distanced life resulted in a dramatic reduction in the transmission of COVID-19… [and] health behaviours, including physical activity, have consequently changed in ways that will result in an unintended increase in the risk of chronic diseases such as cardiovascular disease, obesity, diabetes and cancer (Manuel et al., 2021).
The BC Guidelines for the management of hypertension outline that “[f]or about 90 - 95% of peoples with mildly elevated blood pressure, inactive lifestyle, smoking, excess abdominal weight, a fatty diet, alcohol consumption, and stress contribute to the condition (BC Guidelines - A Guide for Patients: Diagnosis and Management of Hypertension 2019). These factors would be similar reasons for a rise in hypertension incidences at the time of the pandemic. Similarly, Diabetes being the third highest chronic disease listed in the same 2020/2021 fiscal year, would be affected by the effects of the pandemic-related lifestyle changes in the same manner as incidences of Hypertension.
Fraser Health Authority provides Chronic Disease Management services through our outpatient clinics where the nurses and physicians work with the patients in monitoring Diabetes management. There is little monitoring provided directly by the Home Health or outpatient services specifically for hypertension management. However, any changes affecting a client’s long-term history of Diabetes and Hypertension are reported to the family physician and further medication management services are coordinated by the Community Health Nurse. The family physician and/or Nurse Practitioner provides guidance and medication regimens based on the BC Guidelines created by the Ministry of Health and Doctors of BC (2019) to support the management of these chronic diseases.
For any clients in our community experiencing or struggling with chronic or episodic mental health conditions, our CHN connects with the client’s GP/NP to notify them and sometimes can refer them to the FH Adult or Older Adult Mental Health programs.
In comparing the chronic disease indicators for my classmate Georgina’s research from Alberta, we can see that hypertension and diabetes were also in the top three chronic diseases reported in 2020/2021, with hypertension having the highest incidence (Alberta Health Services, 2023). Interestingly Mood and Anxiety incidences are not listed in the statistics provided by Alberta Health Services. Hypertension in BC was more prevalent among the male population compared to the female population outlined in the BCCDC statistics (2021), which is the same for Edmonton as a region, yet the opposite for the whole province of Alberta. Similarly, Diabetes statistics in Alberta and BC show more incidences of Diabetes for males than females, with a concentration of high incidences among ages 65 years and older (Chronic disease dashboard 2023 and Diabetes - Age-Sex Specific Incidence Rate, 2023).
References
BCCDC. (2021, July). Impacts of the COVID-19 pandemic on the health and well-being of young ... A Report by the
British Columbia Centre for Disease Control COVID-19 Young Adult Task Force. http://www.bccdc.ca/Health-
Chronic disease dashboard. BC Centre for Disease Control. (2023). http://www.bccdc.ca/health-professionals/data-
EZ MD Solutions. (2023). Common types of chronic diseases. Prime Health of New Jersey.
Government of BC, BC Guidelines - A Guide for Patients: Diagnosis and Management of Hypertension (2019). Government of BC and Doctors of BC. Retrieved November 3, 2023, from
Government of Canada, S. C. (2023, September 13). Top Five highlights from a new report on the health of Canadians,
2023. The Daily -. https://www150.statcan.gc.ca/n1/daily-quotidien/230913/dq230913b-eng.htm
Manuel, D. G., Eddeen, A. B., Colley, R. C., Tjepkema, M., Garner, R., Bennett, C., & Bernier, J. (2021, June 25). The
effect of COVID-19 on physical activity among Canadians and the future risk of cardiovascular disease. Statistics
Van Beusekom, M. (2022, November 2). US patients tracked high blood pressure less and saw it rise in a pandemic. CIDRAP News. Retrieved November 3, 2023, from https://www.cidrap.umn.edu/covid-19/us-patients-tracked-high-


Comments